The polychlorinated biphenyls (PCB) and polyaromatic hydrocarbons (PAH) are among the most commonly analysed compound classes in environmental analysis. This article demonstrates how hydrogen carrier gas can be used in place of helium for GC-MS/MS analysis of these compounds.
Analysis of polyaromatic hydrocarbons (PAH) is typically conducted using HPLC with UV- and fluorescence detection. Polychlorinated biphenyls (PCB) are usually analysed using GC-ECD (electron capture detection). The analysis run-times are typically around 30 minutes for HPLC and 60 minutes for GC methods. Environmental contaminants such as PCBs and PAHs are present in a variety of matrices. These compounds are usually of industrial origin and they are typically monitored in soil, sewage sludge and drainage water.
Regulations for waste disposal allow waste class 0 (non-harmful waste, mineral waste) to be analysed by GC-MS according to DIN ISO 18287. DIN EN 15308 recommends PCB analysis to be conducted by GC-ECD or GC-MS. Regulations for disposal of sludge mandate that there should be no interference between PCB 101 and o,p’-DDE or ά-Endosulphan as well as PCB 138 and p,p’-DDT. One critical separation within this analysis is that of PCB 28 and PCB 31. Otherwise there is no reason why both classes of compound cannot be analysed using just one GC analysis. This would be advantageous since both analyses combined would offer much shorter analysis time than two separate analyses and would result in reduced costs for the lab user. Additionally, hydrogen carrier gas can be used in place of helium, offering further reduction in time and costs. Migrating all analyses to GC-MS obviously requires optimization and validation of the method.
Here we present a comparison of the results of individual analyses of PCBs and PAHs from soil samples with single-quadrupole GC-MS and a triple-quadrupole GC-MS (TQ-GCMS). The use of hydrogen carrier gas is, however, still a work in progress for the multiple reaction monitoring (MRM) optimization for the TQ-GCMS.
Sample Preparation
Soil samples underwent separate extraction for PCBs and PAHs and were mixed 1:1 prior to analysis. The dilutions for calibration were prepared in cyclohexane. PAH samples were prepared according to technical bulletin number 1 from the German Federal Environment Agency NRW (LUA-merkblatt Nr. 1 NRW). For PCB analysis, the methods in DIN 38 414-20 were followed. For GC-MS/MS analyses, samples were diluted 1:100 in cyclohexane.
Analysis of the PCB/PAH mixture
Standards of 18 polycylic aromatics were mixed 1:1. Figure 1 shows the full-scan chromatogram of the standard mixture. The requirement for separation of PCB 28 and PCB 31 (Peaks 10 and 11 in Figures 1 and 2) were achieved with a resolution of greater than 0.9.
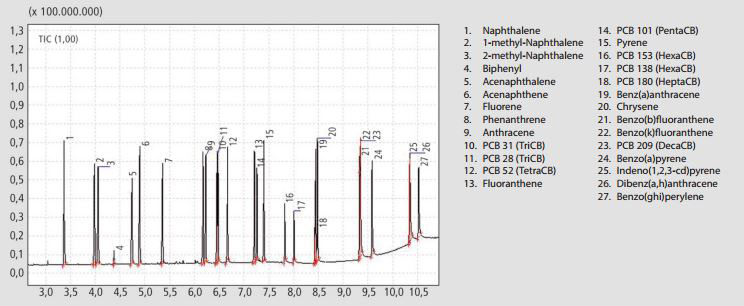
Figure 1. Gas chromatogram of PCB and PAH standard mixture at a concentration of 5 ng µl-1 per component. The full list of compounds can be seen on the right.
Samples were analysed using a Shimadzu GC-MS/MS Triple Quadrupole. The instrument ran as a singlequadrupole MS for SIM detection and as a triple-quadrupole MS for the MRM analyses with argon serving as collision gas. A hydrogen generator from Peak Scientific (Precision Hydrogen 500cc) supplied the high-purity carrier gas. The column used was a Restek Rxi-XLB (20m x 0.18mm x 0.18 µm). Samples were injected using pulsed-splitless injection at 150 kPa for 0.5 min into a hot split/splitless inlet (280 °C). The carrier gas flowed at a constant linear velocity of 80 cms-1. The oven temperature ramp rate was set so that the sample could be separated in around 11 minutes.
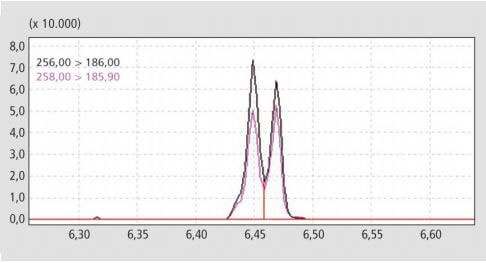
Figure 2. The critical separation of PCB 28 and PCB 31 achieved with the MRM. Compound concentration on column was 5 pg. Chromatographic resolution between peaks was R> 0.94 min.
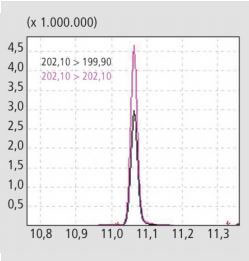
Figure 3. MRM signal for Fluoranthen. The pseudo-transition 202.1>202.1 (red) shows a better sensitivity than the SRM transition 202.1>199.9 (black).
Optimization of Multiple Reactions Monitoring Transitions
Calibration curves were established in the range of 0.5 – 50 pg µL-1 for PCBs and from 5 – 500 pg µL-1 for PAHs. Multiple reaction monitoring transitions for PCB congeners are relatively simple to optimize owing to their fragment stability and allow high sensitivity. Analysis of PAHs with triple-quadrupole MS detectors offers only slightly greater sensitivity than instruments employing SIM detection owing to the high stability of the molecule.
Pseudo-MRM transitions have proven to be advantageous for PAH analysis. Thereby, the mother and daughter ions are set to the same masses in both quadrupole 1 and quadrupole 3. This results in a double filtering of the interfering ions. This double filtering increases sensitivity, at a collision energy that allows the target analytes to survive intact whilst eliminating matrix noise. The optimization of the collision energies for pseudo-MRM gave differing values in standards and samples. Where 5 V was the optimal energy for standard samples, 10V was found to be optimal in soil samples. This phenomenon can only be explained whereby the higher energy fragments the matrix components more strongly without reducing the detector signal. An increase in collision energy above this level leads to a reduction in signal strength of pseudo-MRM transitions for fluoranthene.
Comparison of real soil samples
A prepared soil sample was analysed using the traditional methods of HPLC-UV/Fluorescence and GCECD. The HPLC analysis gave a total content of PAHs in the sample of 7.71 mg kg-1. PAH analysis by GC-MS in SIM mode gave a value of 7.03 mg kg-1 whereas analysis in MRM mode the content was calculated to be 8.08 mg kg-1. Using the GCMS, simultaneous analysis of the complete PCB content of samples could be conducted. Results showed a content of 31 µg kg-1 detected in SIM mode and 45 µg kg-1 detected in
MRM.
For PCB components, the GCMS triple quadruple gave better precision and was even capable of detecting PCB 28 and PCB 52, which were undetected using the GC-ECD. Quantitative analysis showed results in the same order of magnitude, however TQ -GC-MS detection was found to give more sensitive results than GC-ECD detection and compounds previously below the limit of detection were detectable using TQ-GC-MS. With a total runtime of 11 minutes, the combined analysis is at least twice as fast as classical analyses. Hydrogen carrier gas gives improved chromatographic separation at higher linear velocities.
References:
1. Lin, Y.P. Talanta 9/2013, 113:41-48
|
No |
Component |
Retention Time |
Mother Ion |
Daughter Ion |
Collision Energy (V) |
| 1 | Naphthalene (quant. SRM) | 3.37 | 128.1 | 102 | 20 |
| 1 | Naphthalene (qual. SRM) | 3.37 | 128.1 | 128.1 | 10 |
| 2 | 1-Methyl-Naphtalene (quant. SRM) | 3.98 | 142.1 | 115.1 | 20 |
| 2 | 1-Methyl-Naphtalene (qual. SRM) | 3.98 | 142.1 | 142.1 | 10 |
| 3 | 2-Methyl-Naphtalene (quant. SRM) | 4.06 | 142.1 | 115.1 | 20 |
| 3 | 2-Methyl-Naphtalene (qual. SRM) | 4.06 | 142.1 | 142.1 | 10 |
| 4 | Biphenyl (quant. SRM) | 4.38 | 154.1 | 76 | 20 |
| 4 | Biphenyl (qual. SRM) | 4.38 | 154.1 | 154.1 | 10 |
| 5 | Acenaphthylene (quant. SRM) | 4.74 | 152.1 | 151.1 | 30 |
| 5 | Acenaphthylene (qual. SRM) | 4.74 | 152.1 | 152.1 | 10 |
| 6 | Acenaphthene (quant. SRM) | 4.89 | 153.1 | 152.1 | 20 |
| 6 | Acenaphthene (qual. SRM) | 4.89 | 153.1 | 153.1 | 10 |
| 7 | Fluorene (quant. SRM) | 5.36 | 166.1 | 165.1 | 20 |
| 7 | Fluorene (qual. SRM) | 5.36 | 166.1 | 166.1 | 10 |
| 8 | Phenanthrene (quant. SRM) | 6.18 | 178.1 | 152.1 | 20 |
| 8 | Phenanthrene (qual. SRM) | 6.18 | 178.1 | 178.1 | 10 |
| 9 | Anthracene (quant. SRM) | 6.23 | 178.1 | 152.1 | 20 |
| 9 | Anthracene (qual. SRM) | 6.23 | 178.1 | 178.1 | 10 |
| 10 | PCB 31 (TriCB) (quant. SRM) | 6.45 | 256 | 186 | 25 |
| 10 | PCB 31 (TriCB) (qual. SRM) | 6.45 | 258 | 186 | 25 |
| 11 | PCB 28 (TriCB) (quant. SRM) | 6.47 | 256 | 186 | 25 |
| 11 | PCB 28 (TriCB) (qual. SRM) | 6.47 | 258 | 186 | 25 |
| 12 | PCB 52 (TetraCB) (quant. SRM) | 6.67 | 292 | 221.9 | 25 |
| 12 | PCB 52 (TetraCB) (qual. SRM) | 6.67 | 289.9 | 219.9 | 25 |
| 13 | Fluoranthene (quant. SRM) | 7.21 | 202.1 | 199.9 | 35 |
| 13 | Fluoranthene (qual. SRM) | 7.21 | 202.1 | 202.1 | 10 |
| 14 | PCB 101 (PentaCB) (quant. SRM) | 7.26 | 325.9 | 255.8 | 30 |
| 14 | PCB 101 (PentaCB) (qual. SRM) | 7.26 | 323.9 | 253.8 | 30 |
| 15 | Pyrene (quant. SRM) | 7.39 | 202.1 | 199.9 | 35 |
| 15 | Pyrene (qual. SRM) | 7.39 | 202.1 | 202.1 | 10 |
| 16 | PCB 153 (HexaCB) (quant. SRM) | 7.82 | 359.9 | 289.7 | 30 |
| 16 | PCB 153 (HexaCB) (qual. SRM) | 7.82 | 361.9 | 289.9 | 35 |
| 17 | PCB 138 (HexaCB) (quant. SRM) | 8 | 359.9 | 289.7 | 30 |
| 17 | PCB 138 (HexaCB) (qual. SRM) | 8 | 361.9 | 289.9 | 35 |
| 18 | PCB 180 (HeptaCB) (quant. SRM) | 8.43 | 393.9 | 323.8 | 30 |
| 18 | PCB 180 (HeptaCB) (qual. SRM) | 8.43 | 323.9 | 253.8 | 30 |
| 19 | Benz[a]anthracene (quant. SRM) | 8.45 | 228.1 | 226 | 30 |
| 19 | Benz[a]anthracene (qual. SRM) | 8.45 | 228.1 | 228.1 | 10 |
| 20 | Chrysene (quant. SRM) | 8.48 | 228.1 | 226 | 30 |
| 20 | Chrysene (qual. SRM) | 8.48 | 228.1 | 228.1 | 10 |
| 21 | Benzo[b]fluoranthene (quant. SRM) | 9.32 | 252.1 | 249.9 | 35 |
| 21 | Benzo[b]fluoranthene (qual. SRM) | 9.32 | 252.1 | 252.1 | 10 |
| 23 | PCB 209 (DecaCB) (quant. SRM) | 9.33 | 497.7 | 427.6 | 35 |
| 23 | PCB 209 (DecaCB) (qual. SRM) | 9.33 | 495.7 | 425.3 | 35 |
| 22 | Benzo[k]fluoranthene (quant. SRM) | 9.34 | 252.1 | 249.9 | 35 |
| 22 | Benzo[k]fluoranthene (qual. SRM) | 9.34 | 252.1 | 252.1 | 10 |
| 24 | Benzo[a]pyrene (quant. SRM) | 9.58 | 252.1 | 249.9 | 35 |
| 24 | Benzo[a]pyrene (qual. SRM) | 9.58 | 252.1 | 252.1 | 10 |
| 25 | Indeno[1,2,3-cd]pyrene (quant. SRM) | 10.35 | 276.1 | 274 | 35 |
| 25 | Indeno[1,2,3-cd]pyrene (qual. SRM) | 10.35 | 276.1 | 276.1 | 10 |
| 26 | Dibenz[a,h]anthracene (quant. SRM) | 10.35 | 278.1 | 275.9 | 35 |
| 26 | Dibenz[a,h]anthracene (qual. SRM) | 10.35 | 278.1 | 278.1 | 10 |
| 27 | Benzo[ghi]perylen (quant. SRM) | 10.52 | 276.1 | 274 | 35 |
| 27 | Benzo[ghi]perylen (qual. SRM) | 10.52 | 276.1 | 276.1 | 10 |