Introduction
Over the past 5 years, e-cigarettes have become a widespread, popular alternative to conventional tobacco products. Almost 70% of smokers report wanting to stop smoking and often e-cigarettes are cited as an alternative to cigarettes that can begin the process of quitting altogether. An e-cigarette produces an aerosol, rather than smoke, by heating the e-liquid using a heating element. The aerosol, which consists of humectants, flavourings and nicotine is then inhaled by the user.
Part of the popularity of e-cigarettes derives from the variety of flavours as well as the ability of the user to decide on the concentration of nicotine in e-liquid that they use, so that if they wish to quit, a weaning process can be undertaken with the aim of reducing nicotine intake, and ultimately, a person’s dependence on this highly addictive compound.
The component parts of e-cig liquid and the likely vaporized compounds have been subject of great interest for consumer safety bodies in countries and organisations. The U.S. Food and Drug Administration (FDA) and The Centers for Disease Control (CDC) have studied users of e-liquids who have developed health problems attributed to use of e-liquids and found that most cases were associated with users who modified their vaping device, or had used black market modified e-Liquids. Vitamin E acetate, which is used in black market e-liquids as a thickening agent is thought to be one product that can cause lung damage, and screening for compounds known to have health effects is becoming increasingly important in the industry.
Companies that produce e-liquids are seeing increasingly stringent regulation, for example, UK law states that all ingredients used in quantities greater than 0.1% must be labelled, with nicotine content being allowed up to a maximum concentration of 20mg/mL1. Responsible suppliers are also screening for toxic impurities to prevent them causing damage to the health of their customers. A study by Restek showed that the stated nicotine content on packaging did not always match that of the liquid2, but as regulation around e-liquids tightens, there is more onus on suppliers to produce a consistent product that states the true quantity of nicotine and any other products that are required for labelling. Indeed, the EU legislation on e-cigarettes states that “Packaging must also include a list of ingredients contained in the product, information on the product's nicotine content, and a leaflet with instructions for use and information on adverse effects, risk groups, addictiveness and toxicity.”
Experimental
All analyses were carried out on Jucce e-Liquids using an Agilent 5977 GC-MSD with carrier gas supplied by a Peak Scientific Precision Hydrogen Trace 500cc.
Sample Preparation
One drop of e-liquid (appx 20mg) should be accurately weighed in a glass vial, to which 5mL of internal standard solution is added. The mixture is then shaken. , transferred to a GC vial and analysed.
Calibration
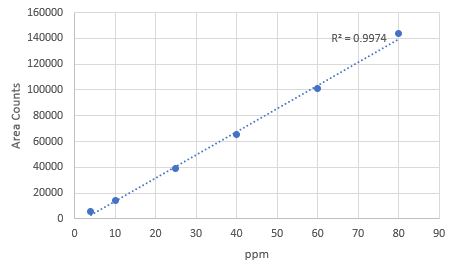
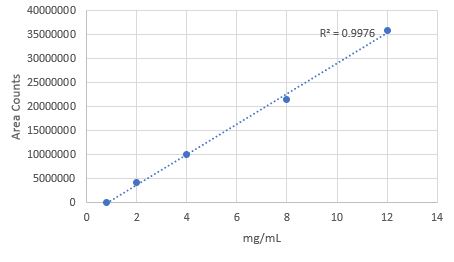
A five-level calibration curve was established for all target compounds, with Nicotine detected across the range of 4ppm-80ppm, glycerol detected across the range of 0.8-12.0 mg/mL and propylene glycol detected across the range of 0.1-2.0 mg/mL (Figure 1).
Agilent 5977 GC-MSD Method conditions
|
Hardware |
Split/Splitless Inlet |
|
Agilent 5977 GC-MSD |
Carrier gas - Hydrogen Inlet temperature - 280°C |
|
DB- Select 624 Ultra Inert Column, |
Column flow - 1.1 mL/min |
|
30m x 0.25 mm x 1.4 µm |
Split ratio -50:1 |
|
|
Column temperature - 50°C for 2 min |
|
|
20°C / min to 230°C |
|
|
Transfer line temp - 280°C |
|
MSD Conditions |
|
|
|
|
|
Acquisition mode |
SIM/Scan |
|
Solvent delay |
4 mins |
|
Mass range Total Run Time |
30 – 300 11mins |
e-liquid was screened for propylene glycol, butane diol (internal standard), glycerine and nicotine.
Results
Results of the analysis of e-Liquid by GC-MS, using hydrogen carrier gas shows that a calibration curve of the active ingredient, nicotine, showed good linearity across a concentration range of 5-80 ppm (Figure 1). E-liquid samples were monitored in simultaneous SIM/Scan detection mode to allow quantitative analysis of propylene glycol, glycerol and nicotine in SIM detection (figure 3) as well as detection of any unknown contaminants using full scan detection. As can be seen in Figure 2., the limit of detection would allow for detection of impurities in the low-ppm/high-ppb range, although ppm-range detection levels of nicotine were required for this application.
Hydrogen carrier gas is sometimes seen as a risk for GC-MS analysis because of the risk of protonation of analytes, which can react with hydrogen in the GC inlet, if sample transfer is not efficient enough. Figure 3 shows that the ion chromatograms of the target compounds show little evidence of protonation, meaning that hydrogen is not reacting with analytes. When screening for known compounds, SIM detection can further improve signal response when using H2 carrier gas. Results of SIM/Scan detection (Figure 2&3) show that the target compounds were well resolved and could be clearly detected.
Discussion
As e-liquids have grown in popularity, they have come under an increasing level of regulation to ensure that their consumption is as safe as possible. Companies producing e-liquids not only need to ensure consistent quality of product, but also screen for impurities to safeguard their customers. GC-MS systems have numerous advantages over other GC systems because of the versatility of the MS detector, but GC-MS analysis using hydrogen carrier gas can sometimes present challenges because of loss of sensitivity or reaction between hydrogen carrier gas and analytes.
Since background signal can sometimes be elevated when using hydrogen carrier gas, simultaneous SIM/Scan detection allows for detection of unknown compounds (impurities) in scan mode, whilst improving resolution of target peaks for quantitative analysis using SIM detection. The results from this analysis showed good response with both SIM and full scan detection, although SIM detection is advantageous for quantitative analysis since any signal interference is filtered out.
Another way to improve library search results for unknown compounds can be improved is to use ‘background’ subtraction, which can reduce background noise sometimes associated with H2 carrier gas and improve library search results. The ion chromatograms presented here show no effect of protonation, which can sometimes occur when using hydrogen carrier gas with some analytes.
This study shows that reliable analysis of the key components of e-liquid and precise analysis of nicotine content can be easily achieved when using hydrogen carrier gas.
References
A
B
C
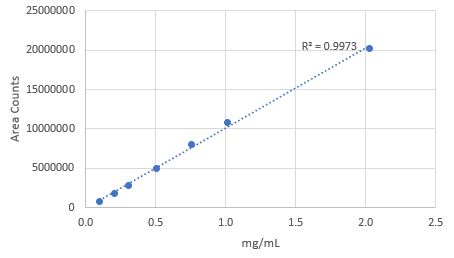
Figure 1. Calibration curve of 1A nicotine, 1B Glycerol, & 1C Propylene glycol
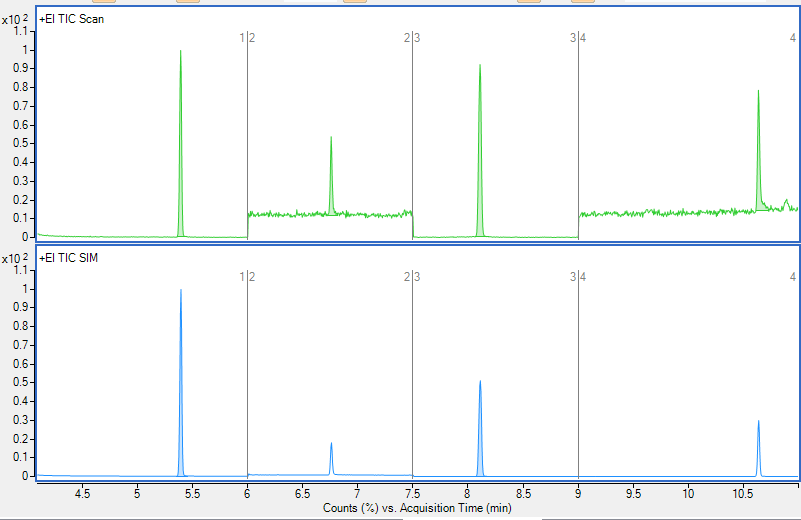
Figure 2. SIM/Scan chromatogram of e-Liquid showing propylene glycol, internal standard, glycerol and nicotine.
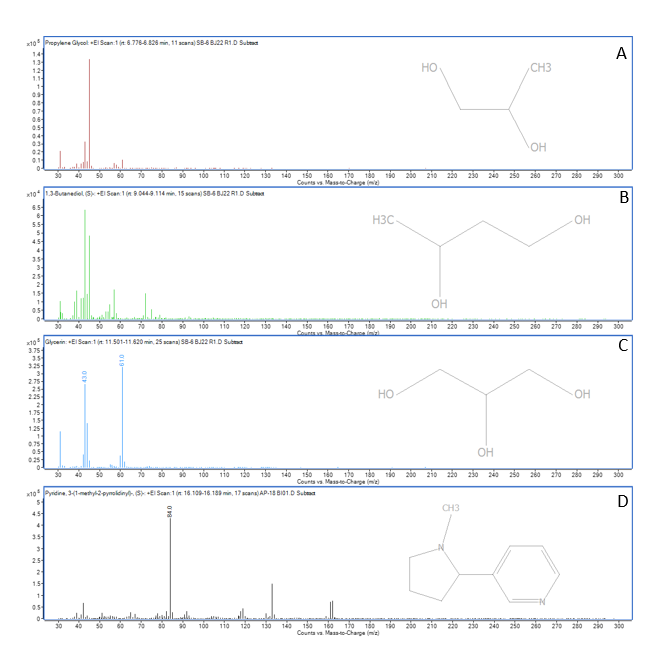
Figure 3. Ion chromatograms of (3A) propylene glycol, (3B) (S)-butane diol (internal standard), (3C) glycerol, & (3D) nicotine.