Converting Semivolatile GC-MS/MS Methods from Helium to Nitrogen Carrier Gas with APGC, an Atmospheric Pressure Ionization Source
Douglas Stevens, Frank Dorman, David Gould, Peter Hancock, Kenneth Rosnack, Timothy Jenkins Waters Corporation, Milford, MA, USA
INTRODUCTION
Helium, hydrogen, and nitrogen are the three most used carrier gases for gas chromatography (GC).1 Especially for GC-MS, helium is the traditional first choice based on compatibility with vacuum source mass spectrometers as well as its inertness and the combined chromatographic separating power and speed.
Hydrogen carrier gas, while common for some methods such as GC FID analyses, has been less commonly used with mass spectrometry (MS). This is largely due to its inherent reactivity which leads to undesirable reactions in electron ionization (EI) sources that may adversely affect both qualitative and quantitative analyses. Furthermore, hydrogen’s reactive nature can lead to chromatographic challenges such as the creation of undesirable active sites in the injection port.2 There are then prospective problems for hydrogen carrier gas in both components of a traditional GC-MS system despite the excellent resolving power and speed of chromatographic separation it provides.
In the past nitrogen has also presented challenges for both GC and MS components of GC-MS systems. In an EI source, nitrogen can be difficult to pump out efficiently and leads to the formation of high levels of azide chemical background. These characteristics have led to it being overlooked as an alternative carrier gas option to helium due to the presumption of slower chromatographic separation and mass spectral performance with significant interferences. This is despite the fact it is recognized to be much more inert than hydrogen which is a beneficial carrier gas trait for both chromatographic and ionization reasons. However, some traditional assumptions about nitrogen carrier gas performance warrant revisiting considering advances in ionization source design.
In this work, four common semivolatile applications were used to evaluate the performance of nitrogen carrier gas compared to helium using atmospheric pressure chemical ionization GC-APCI MS/MS.
The most relevant change in technology evaluated in this work, with respect to a fresh look at the performance of nitrogen as a carrier gas, is the APGC™ (Atmospheric Pressure Gas Chromatography) source. The design of this source incorporates the use of nitrogen gas flow as a reagent and sweep gas, regardless of the carrier gas choice. This nitrogen compatibility by-design, combined with the chemical ionization mechanisms employed, effectively eliminates the azide interference issues experienced with EI systems especially when using MS/MS for common semivolatile target analyses. Improvement of mass-flow control of the carrier gas in the GC further adds to the improved performance of nitrogen carrier gas over expectations one might have due to classic examples based on isothermal separations included in foundational publications and textbooks.
OVERVIEW
Despite the positive performance characteristics of helium carrier gas, it has been the cause of interrupted productivity and unexpected cost increases during the recurring supply shortages that have plagued it in recent years. This has led to the need to evaluate alternative methods and instruments able to provide data of equal to or better quality than traditional EI GC/MS without a high-risk dependency on helium supply. In this work nitrogen carrier gas-based GC/MS methods using an atmospheric ionization source on a tandem quadrupole mass spectrometer are compared to legacy methods using helium carrier gas and EI on either magnetic sector or tandem quadrupole MS reference methods. The analyte classes evaluated include polycyclic aromatic hydrocarbons (PAH), organochlorine pesticides (OCP), polychlorinated naphthalenes (PCN), and phthalates. All methods were run in dry source mode which generates the charge transfer form of the molecular ion (M+.) using only nitrogen as the chemical ionization reagent gas.
One important consideration when converting methods from helium to nitrogen carrier gas centers around the choice of column. In order to provide similar analysis time and separating power of a nitrogen carrier gas method to a helium carrier gas method it is necessary to scale the analytical column dimensions by decreasing its length while keeping the phase ratio constant. This is primarily due to the lower optimum linear velocity of nitrogen, 10 – 15 cm/s, versus that of helium, 25 to 35 cm/s. For instance, given a helium-based method using the common column dimensions of 30 m length x 0.25 mm id x 0.25 µm film thickness, the similarly optimized nitrogen carrier column would be 20 m x 0.15 mm x 0.15 µm. However, the exact scaled column may not be commercially available; or users may simply prefer to continue the use of a well characterized, time tested column. So, one of the methods evaluated in this work, the PAHs, used the exact same column with both carrier gases. Another two of the analyses, the OCPs and PCNs used the closest to optimum scaled column that was commercially available. And, the final method, the phthalates, used the optimally scaled column dimensions for each carrier gas.
POLYCYCLIC AROMATIC HYDROCARBONS
Beginning with the PAH analysis, the APGC Xevo™ TQ-XS System was first set up such that the retention time (RT) of the first and last eluting analytes closely matched the reference EI GC high resolution mass spectrometry (HRMS) method which uses helium carrier gas and an Rxi-35Sil MS 30 m x 0.25 mm x 0.25 µm column. The optimum comparable helium flowrate for APGC is commonly somewhat higher than an EI based reference method. This is due to the fact that EI systems have a vacuum drawing on the end of the capillary column while the APGC source is at atmospheric pressure that the carrier gas must push against. So, while the initial helium flow was 1 mL/min in the reference method, the APGC method used 1.7 mL/min to reproduce RTs and separating power. Separations between critical pairs were maintained using this approach. As the method included an extended list of analytes, multiple reaction monitoring (MRM) transitions for the full 52 analytes and 15 isotopically labelled internal standards plus surrogates were developed and all 67 compounds were monitored using multiple MRM transitions.
A calibration curve from 1 to 200 ppb and two standard reference materials (SRMs) at two dilution levels were analyzed using this helium carrier gas method.
The system was then switched to nitrogen carrier gas using the same analytical column. The initial nitrogen flowrate was set to 0.80 mL/min which is approximately half the flowrate used with helium. This led to slightly longer retention times for all analytes but comparable chromatographic resolution for both early and late eluting analytes as shown in Figures 1 and 2. The differences in RT led to the need to modify both the acquisition and processing methods as part of the conversion between helium and nitrogen. This conversion of acquisition and processing methods is only required on a single occasion when switching permanently to nitrogen. Following the refinement of this method, the sample batch described above was repeated. For the SRM (NIST 1944 New York/New Jersey Waterway Sediment prepared in duplicate with each also diluted 10:1), the calculated concentrations from the nitrogen carrier gas data agreed with the reference method results within <17% average error (16.2, 14.9, 15.4 and 16.6%) across the 41 and 42 analytes detected in each. . Indene and acenaphthylene were excluded from the comparisons as they showed consistent, reproducibly higher values than the reference method. Contamination during storage and shipment of these samples is suspected as the most likely cause of this since over two years elapsed between analysis by EI HRMS and APGC-MS/MS. Dibenzo(a,h)acridine was not detected in one of the preparations of the SRM in either the concentrated or diluted aliquot. Linear response was observed for all PAHs in the helium and nitrogen data across the range of 1 to 200 ppb with an average coefficient of determination (r2 ) of 0.9978 and 0.9983, respectively.
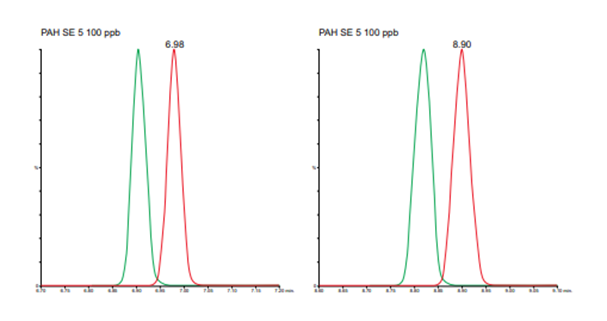
Figure 1. Overlaid chromatograms for two early eluting compounds, naphthalene-d8 (green) and naphthalene (red), in helium mode (left) and nitrogen mode (right).
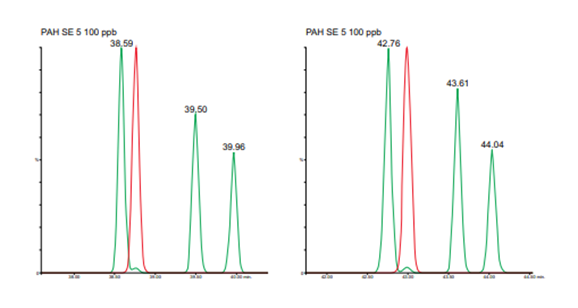
Figure 2. Overlaid TICs for last four eluting PAHs in helium mode (left) and nitrogen mode (right) dibenzo[ae] pyrene, coronene, dibenzo[ai]pyrene and dibenzo[ah]pyrene.
ORGANOCHLORINE PESTICIDES
For the OCPs the same initial approach was used with the first and last eluting peak RTs being matched with the reference method while using helium carrier gas flowrate at 1.5 mL/min with a Rxi-5Sil MS 60 m x 0.25 mm x 0.25 µm column. As the list of 39 analytes plus 11 internal standards and surrogates included compounds that had not previously been analyzed in our lab, multiple MRM transitions were developed for each compound. A calibration curve from 1 to 200 ppb and two SRMs were analyzed using this helium carrier gas method.
The system was then switched to nitrogen carrier gas and a scaled column of different dimensions, 40 m x 0.18 mm x 0.18 µm, but the same stationary phase was installed. The optimum range for carrier gas investigation was then obtained using EZGC Method Translator (Restek).3 The nitrogen carrier gas was then optimized by monitoring the valley between critical pairs at different flowrates. This resulted in a nitrogen carrier gas method with a flowrate of 0.45 mL/min in which all RTs were within 1.1 seconds of the helium method as in Figure 3. This allows a single MS acquisition file and a single quantification method to be applied to both the helium and nitrogen data. Examples of critical pair separations with each column and carrier gas are shown below in Figures 4 and 5. Comparisons of sensitivity showed all analytes within a factor of +/- 2X between the two carrier gases with some giving better signal-to-noise with nitrogen and some with helium. Figure 6 shows the sensitivity performance comparison for hexachlorobenezene (HCB). For the SRMs, the calculated concentrations from the nitrogen carrier gas data agreed with the reference method results within <17% average error (16.3% and 16.3%) across the 14 and 22 analytes detected in each, respectively. Chlorothalonil, o,p DDT, and methoxychlor were excluded from comparison in the first SRM (NIST 1944 New York/New Jersey Waterway Sediment) as they showed consistent, reproducibly higher values than the reference method. While no specific cause of this was determined, these sample were stored for over three years between the original analysis by EI HRMS and subsequent APGC-MS/MS analysis. All 22 detected analytes were included in the evaluation of the second SRM (NIST 1946 Lake Superior Fish Tissue). Linear response was observed for all OCPs in the helium and nitrogen data across the range of 1 to 200 ppb with an average r2 of 0.9960 and 0.9991, respectively. While this method was focused on a single analyte class, recent work converting multi-residue pesticides analyses to nitrogen carrier gas has demonstrated the feasibility of method conversion for additional matrices and multi-class analyses.4
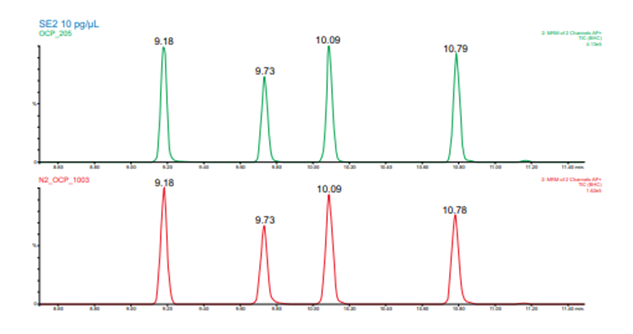
Figure 3. Upper, green, chromatogram from the 60 m column helium carrier gas method. Lower, red, chromatogram from the 40 m column nitrogen carrier gas method. The peaks in each are for the four BHC isomers included in the method. Elution order is alpha, beta, gamma (lindane), and delta BHC.
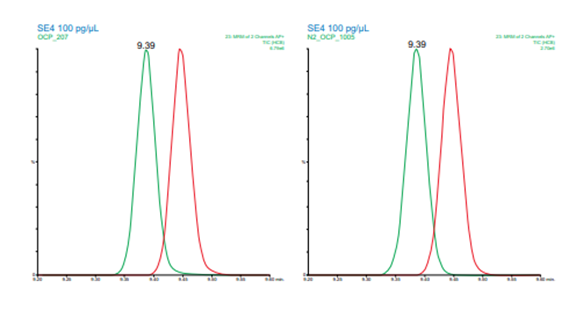
Figure 4. Resolution between hexachlorobenzene and pentachloroanisole for helium (left) and nitrogen (right) carrier gas.
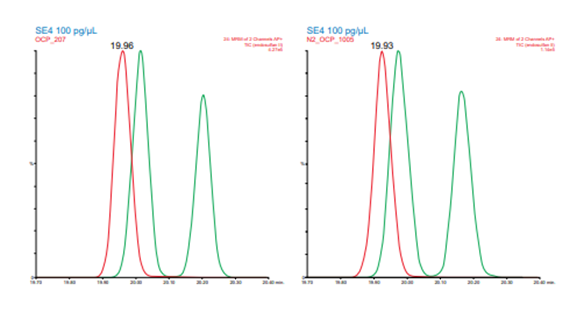
Figure 5. Resolution between endosulfan II and p,p DDD for helium (left) and nitrogen (right) carrier gas
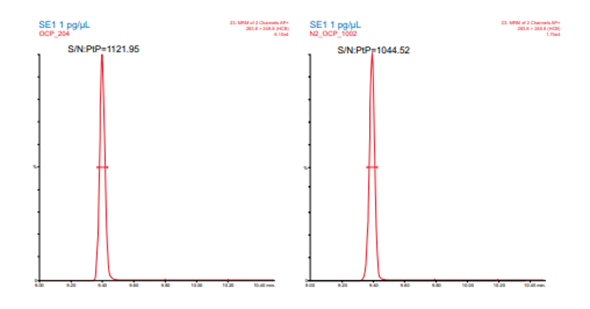
Figure 6. Signal-to-noise for 1 pg hexachlorobenzene for helium (left) and nitrogen (right) carrier gas
POLYCHLORINATED NAPHTHALENES
For the analysis of 18 PCNs and eight internal standards plus surrogates, the same columns and workflow were used as with the OCPs. This resulted in a helium method using 1.7 mL/min flowrate and a nitrogen method using 0.55 mL/min flowrate. Figure 7 shows an example of a critical pair separation from that data. A calibration curve from 1 to 200 ppb was analyzed using each carrier gas. Linear response was observed for all PCNs in the helium and nitrogen data across the range of 1 to 200 ppb with an average r2 of 0.9997 and 0.9990, respectively.
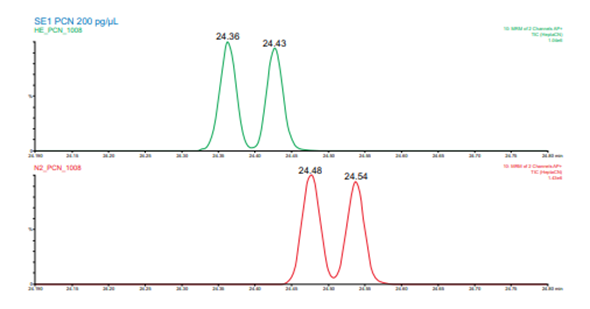
Figure 7. Resolution between 1,2,3,4,5,6,7- and 1,2,3,4,5,6,8- heptachloronaphthalene isomers for helium (upper, green) and nitrogen (lower, red) carrier gas
PHTHALATES
Finally, for phthalates the method development steps described above were followed with the exceptions that the columns were the same stationary phase and different dimensions; the reference method for this analysis is based on EI TQ-MS/MS; and the MRM transitions were optimized to be similar to those used in the EI method.
The columns used for the phthalates were an Rxi-5Sil MS 30 m x 0.25 mm x 0.25 µm for helium and 20 m x 0.15 mm x 0.15 µm for nitrogen. As opposed to the previously described analyses in this work, the phthalates were analyzed using a high cone voltage setting to cause in-source CID to fragment the charge transfer form of the molecular ions generated with the dry source mode of APGC. As this mode leads to the formation of the radical cation form of the molecular ion, as is the case for EI, many of the same MRM transitions can be used in APGC as were used in the reference method. A calibration curve from 1 to 1000 ppb was analyzed using each carrier gas.
While comparing the calibration curves from the separate helium and nitrogen carrier gas batches, excellent agreement between the response, linearity and chromatographic resolution was observed. This led to the two sample batches being processed in a single processing batch although they had been acquired on different days with different columns and carrier gases. For the combined data set r2 for 16 of 17 analytes averaged 0.996 with none below 0.991. See examples in Figures 8 and 9. Bis 2 ethyl hexyl phthalate was excluded from the linearity evaluation due to significant contamination in the available solvents. The %RSD for all 11 internal standards and surrogates across the combined batches averaged 7.69% with none >10%. This indicates the possibility of converting from helium to nitrogen carrier gas while maintaining comparisons of future data to historic data sets for some methods.
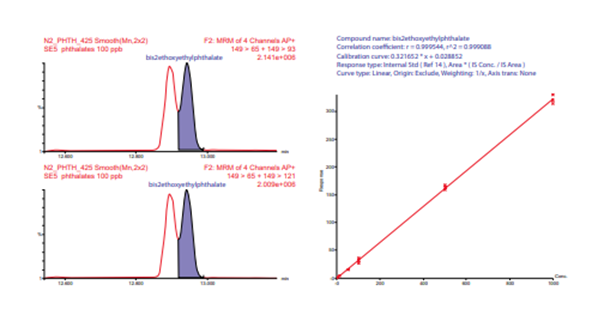
Figure 8. Resolution between bis (4-methyl-2-pentyl) phthalate and bis (2-ethoxyethyl) phthalate for nitrogen. Calibration curve for bis (2-ethoxyethyl) phthalate created from combined helium and nitrogen carrier gas data (n = 4, 2 He and 2 N2 ).
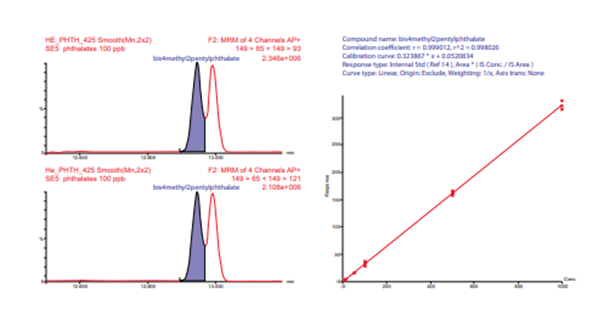
Figure 9. Resolution between bis (4-methyl-2-pentyl) phthalate and bis (2-ethoxyethyl) phthalate for helium. Calibration curve for bis (4-methyl2-pentyl) phthalate created from combined helium and nitrogen carrier gas data (n = 4, 2 He and 2 N2 ).
CONCLUSIONS
All four methods investigated demonstrated effective translation from helium to nitrogen carrier gas for the class specific target analysis of PAHs, OCPs, PCNs, and phthalates. Optimum MRM transitions were found to be independent of carrier gas type allowing the use of identical transitions for all comparisons. Analysis time, response and separation efficiency were maintained by scaling the column dimensions for nitrogen methods. When the same column was used with each gas, a minimal increase of 10% in analysis time was observed. Chromatographic separation of critical pairs was effectively maintained when scaled columns were used which further allowed for the use of identical MS acquisition and quantification methods with both gases for some methods. The APGC-MS/MS methods relying on nitrogen carrier gas demonstrated good correlation to results achieved by EI HRMS and MS/MS reference methods.
Acknowledgements
The authors would like to thank the Quebec Laboratory for Environmental Testing (QLET) at Environment and Climate Change Canada for providing the reference methods and samples for this study
References
- Grob, K., and G. Grob. “Practical capillary gas chromatography—a systematic approach.” Journal of High Resolution Chromatography 2.3 (1979): 109-117
- US Environmental Protection Agency. Method 8270E (SW-846): Semivolatile Organic Compounds by Gas Chromatography/ Mass Spectrometry (GC/MS) available via 8270E Link, 2018
- Cochran, Jack, and Jaap Zeeuw. “Changing from helium and nitrogen while maintaining separation efficiency and analysis time.” Column 11.19 (2015) Article Link Method Translator Link
- Saito-Shida, Shizuka, et al. “Multi-residue determination of pesticides in green tea by gas chromatography-tandem mass spectrometry with atmospheric pressure chemical ionisation using nitrogen as the carrier gas.” Food Additives & Contaminants: Part A 38.1 (2021): 125-135